The Portus Control centre provides a single-point-of-control facility for managing Portus server configurations.This information was developed for ...
If the Portus perspective is not active already open it by selecting Window, ->Open Perspective -> Other -> Portus.
First steps with the Portus Control Centre - Administration Perspective
- The primary elements of the Portus Perspective are
- Portus View - lists defined servers and their defined drivers and services.
- Portus Action Log - displays informational and error messages
- Properties View - lists specific detail about a specific service / resource
- Navigator View - displays the contents of workspace in use. The files listed here are on the local disk.
- Editor View - this opens the required resource in the appropriate editor.
Important: At any time, you can choose Window, Reset Perspective to restore the original
layout.
- The first action to be carried out is to define a server.
Important: The Deployment Wizard may have created a server already, so this step may be skipped in this scenario.
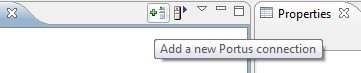
Click on the server icon to the right of the
Portus
tab to bring up the add New Server Dialog.
- ServerName: Enter a symbolic name for the server to be defined.
- Host/IP: Enter the servers host name / IP address.
- Port: Enter the port the server is listening on.
- Timeout (sec): In case the server is slow in responding to requests from the Control Centre, the timeout may need to be set to a value higher than the default of 10 seconds.
- Autodisconnect: Check this box if you want each of the defined servers to be put into a suspended mode when Eclipse exits. This is be useful as it speeds up Eclipse initialization. Although, once the Control Centre starts, you will have to resume each of your servers before working with them again.
Click "Save".
The server will appear in the Portus View. Servers whch are reachable are indicated by a green arrow, unreachable servers are denoted by a red circle, a message in the Properties area indicates the reason why the server cannot be contacted. Clicking on a server entry in the Portus View will trigger the display of the server's configuration in the Properties View. The PropertiesView gives comprehensive information about each server's configuration. The side tabs are:
- General
- Tracing
- Global
- Drivers
- Governance
- Statistics
- More information about the various views and their functions can be found in the Portus Control Centre section.